Request-based tracing is available both in stand-alone IIS Servers and on Windows Azure Web Sites (WAWS) and provides a way to determine what exactly is happening with your requests and why, provided that you can reproduce the problem that you are experiencing. Problems like poor performance on some requests, or authentication-related failures on other requests, or the server 500 error from ASP or ASP.NET can often be difficult to troubleshoot--unless you have captured the trace of the problem when it occurs. the following article discusses failed request tracing on IIS Server. For information about doing this with Windows Azure Web Sites click here
Failed-request tracing is designed to buffer the trace events for a request and only flush them to disk if the request "fails," where you provide the definition of "failure". If you want to know why you're getting 404.2 error messages or request start hanging, use failed-request tracing.
The tasks that are illustrated in this article include:
- Enabling the failed-request tracing module
- Configuring failed-request tracing log-file semantics
- Defining the URL for which to keep failed request traces, including failure definitions and areas to trace
- Generating the failure condition and viewing the resulting trace
Prerequisites
Install IIS
You must install IIS 7 or above before you can perform the tasks in this article. Browse to http://localhost/ to see if IIS is installed. If IIS is not installed, see Installing IIS on Windows Server 2008 for installation instructions. When installing IIS, make sure that you also install the following:- ASP.NET (under World Wide Web Services - Application Development Features - ASP.NET)
- Tracing (under World Wide Web Services - Health and Diagnostics - Tracing)
Log In as Administrator
Ensure that the account that you use to log in is the administrator account or is in the Administrators group.Note: Being in the Administrators group does not grant you complete administrator user rights by default. You must run applications as Administrator, which you can do by right-clicking on the application icon and selecting Run as administrator.
Make a Backup
You must make a backup of the configuration before doing the following tasks.To make a backup of the configuration:
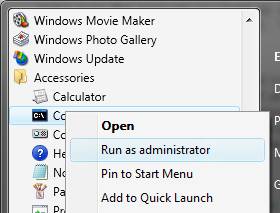
- Click Start -> All Programs -> Accessories.
- Right-click Command Prompt, and then click Run as administrator.
3. In a command prompt, run the following command:
%windir%\system32\inetsrv\appcmd add backup cleanInstall
Create Sample Content
- Navigate to %systemdrive%\inetpub\wwwroot.
- Move the content to a secure location (in case you want to restore the existing content) or delete it.
- Create a blank file and name it test.asp.
- In the command prompt, navigate to the test.asp file in \inetpub\wwwroot.
- In the test.asp file, paste the following content:
Failed Request Tracing Lab
Today's date is <% response.write(Date()) %>
Disable ASP
ASP must be disabled for this task. ASP is disabled only as an example and for the purposes of the tasks in this article.To disable ASP:
- Open IIS Manager.
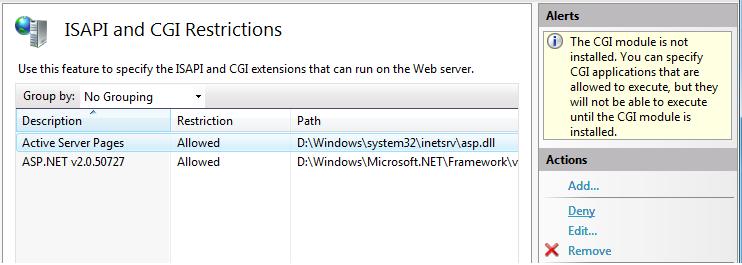
- Double-click ISAPI and CGI Restrictions.
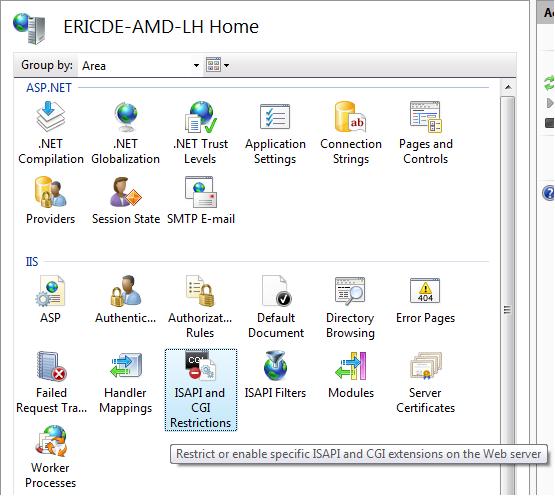
3. Select Active Server Pages. In the Actions pane, click Deny to disable ASP.
Enable Failed-Request Tracing
After you enable failed-request tracing, you need to configure where the log files will reside. In this task, you will enable failed-request tracing for the Default Web Site and specify where to put the log files. You will then configure the failure for which to generate failure logs.Step 1 : Enable Failed-Request Tracing for the Site and Configure the Log File Directory
- Open a command prompt with administrator user rights.
- Launch inetmgr.
- In the Connections pane, expand the machine name, expand Sites, and then click Default Web Site.
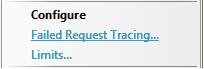
- In the Actions pane, under Configure, click Failed Request Tracing….
5. In the Edit Web Site Failed Request Tracing Settings dialog box, configure the following:
- Select the Enable check box.
- Keep the defaults for the other settings.
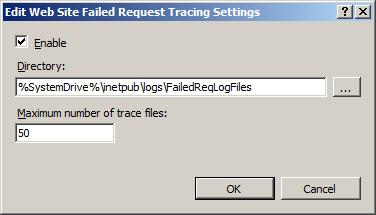
6. Click OK.
Failed-request tracing logging is now enabled for the Default Web Site. Check the %windir%\system32\inetsrv\config\applicationHost.config file to confirm that the configuration looks as follows:
Step 2 : Configure Your Failure Definitions
In this step, you will configure the failure definitions for your URL, including what areas to trace. You will troubleshoot a 404.2 that is returned by IIS for any requests to extensions that have not yet been enabled. This will help you determine which particular extensions you will need to enable.- Open a command prompt with administrator user rights.
- Launch inetmgr.
- In the Connections pane, expand the machine name, expand Sites, and then click Default Web Site.
- Double-click Failed Request Tracing Rules.

5. Click Finish.
6. In the Actions pane, click Add....
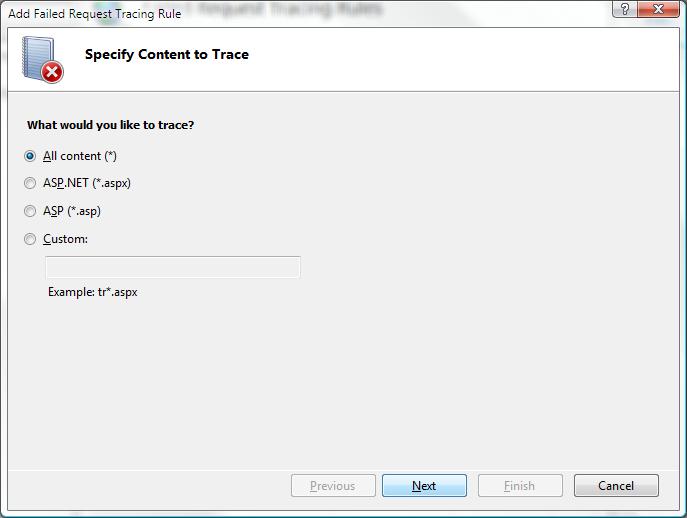
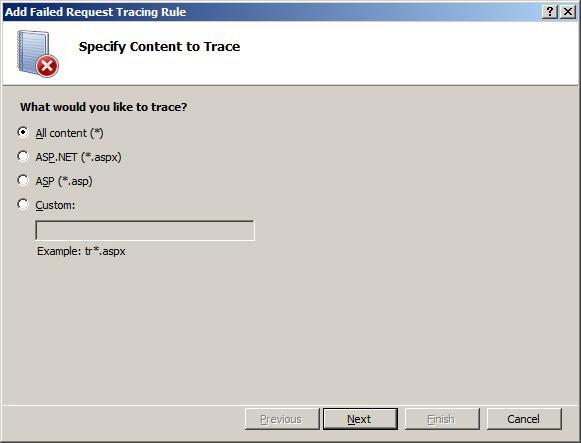
7. In the Add Failed Request Tracing Rule wizard, on the Specify Content to Trace page, select All content (*). Click Next.
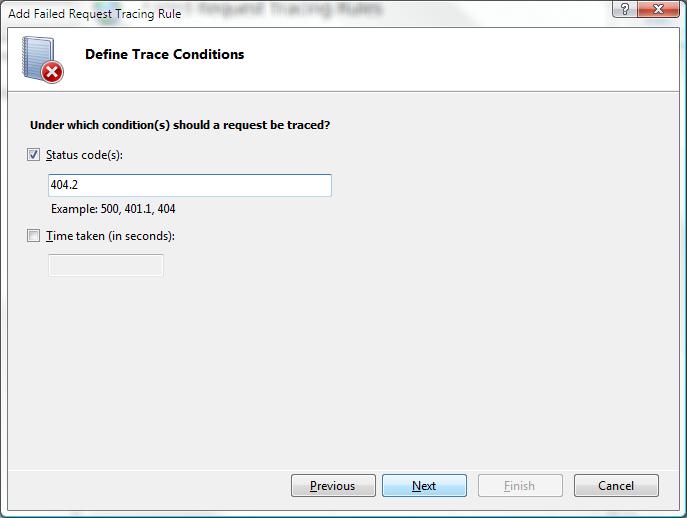
8. On the Define Trace Conditions page, select the Status code(s) check box and enter 404.2 as the status code to trace.
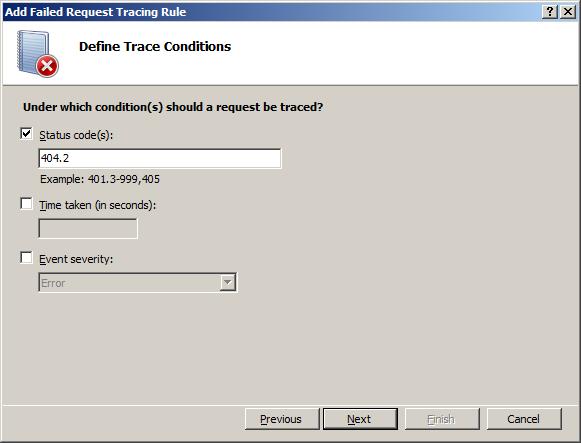
9. Click Next.
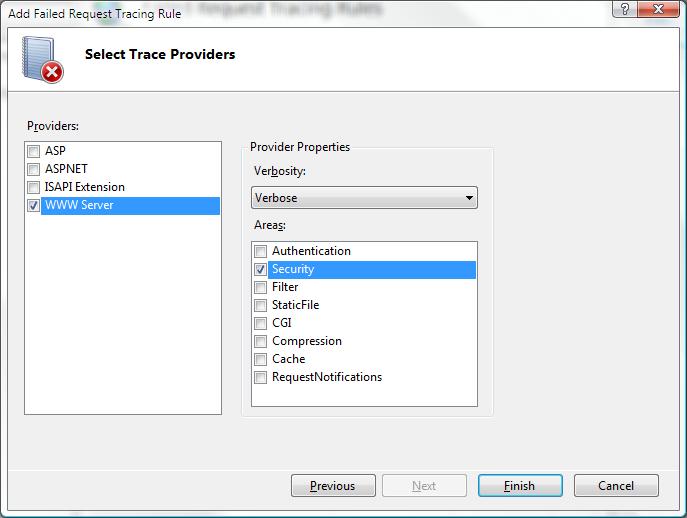
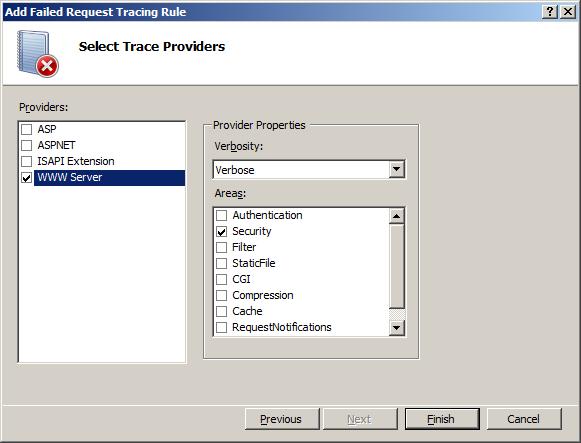
10. On the Select Trace Providers page, under Providers, select the WWW Server check box. Under Areas, select the Security check box and clear all other check boxes. The problem that you are generating causes a security error trace event to be thrown. In general, authentication and authorization (including ISAPI restriction list issues) problems can be diagnosed by using the WWW Server – Security area configuration for tracing. However, because the FREB.xsl style sheet helps highlight errors and warnings, you can still use the default configuration to log all events in all areas and providers.
Under Verbosity, select Verbose.
11. Click Finish. You should see the following definition for the Default Web Site:

IIS Manager writes the configuration to the %windir%\system32\inetsrv\config\applicationHost.config file by using a
Test and View the Failure Request Log File
In this task, you will generate a failed request and view the resulting trace log. You already configured IIS to capture trace logs for http://localhost/*.asp requests that fail with an HTTP response code of 404.2. Now verify that it works.Step 1 : Generate an Error and the Failure Request Log File
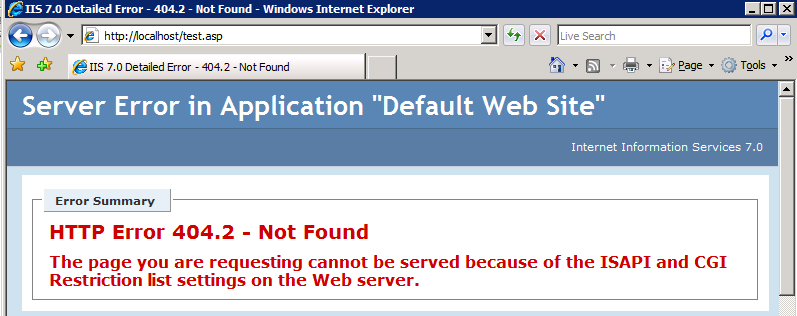
- Open a new Internet Explorer window.
- Type in the following address: http://localhost/test.asp.
- You should see the following:
Step 2 : View the Failure Request Log File
- Now that you have generated a failed request, open a command prompt with administrator user rights and navigate to %systemdrive%\inetpub\logs\FailedReqLogFiles\W3SVC1.
- Run start to start an Internet Explorer window from the directory.
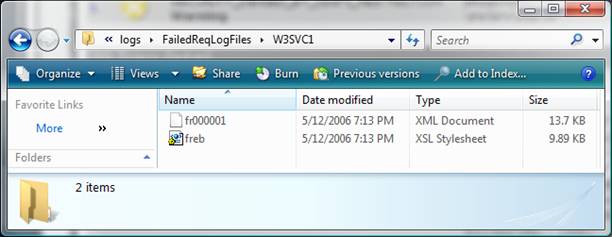
3. Notice a few things here: When IIS writes the failed request log file, it writes one file per failed request. A freb.xsl style sheet is also written, one per directory. This helps when you view the resulting failure request log files (such as fr000001.xml above).
4. Right-click the log file for the 404.2 error, and click Open With -> Internet Explorer. If this is the first time that you are opening a Failed Request Tracing file, you must add about:internet to the list of trusted sites, since Internet Explorer's Enhanced Security Configuration is enabled by default. If this is the case, you will see the following:
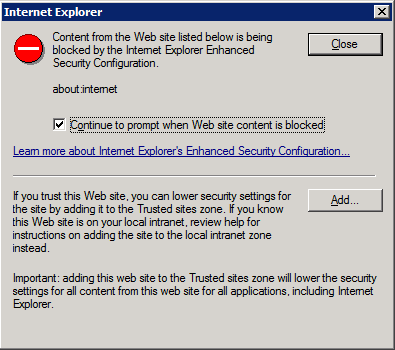
5. In the Internet Explorer dialog box, click Add… to add about:internet to the list of trusted sites. This allows the XSL to work. You will see the following after adding about:internet to the list of trusted sites:
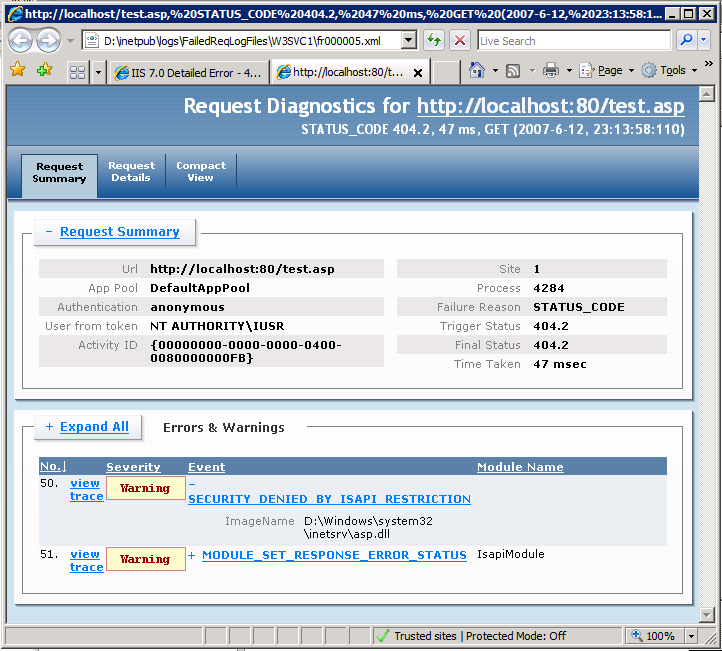
A summary of the failed request is logged at the top, with the Errors & Warnings table identifying any events that are WARNING, ERROR, or CRITICAL ERROR in severity. In this example, the WARNING severity level is due to ISAPI RESTRICTION. The image that you tried to load was %windir%\system32\inetsrv\asp.dll.
6. Open the raw XML file directly by using a text editor, and look at the contents of each event.
Summary
You have completed two tasks: configured failed request tracing to capture traces for * if IIS returns it with a 404.2 status code; and verified that IIS captured the trace for your request. You also verified that the freb*.xml log file did not contain any other requests for the requests that you made because the requests did not have a 404.2 return code. When you consult the failure log file, you determined that the cause of the failure was that the extension was disabled for that request. You can try other non-HTML pages (like gifs or jpgs) and note that the log file does NOT add these traces. You can also easily change this to be 404, or capture the failure if the request takes longer than 30 seconds by setting the timeTaken field in your failureDefinitions.Restore Your Backup
Now that you have completed the tasks in this article, you can restore the backup of the configuration. Run the following command with administrator user rights:%windir%\system32\inetsrv\appcmd restore backup cleanInstall
No comments:
Post a Comment